

Ruggerblogger 2015 app for iPhone and iPad
Developer: CRAIG LUCINSKY
First release : 03 Jun 2014
App size: 64.42 Mb
Ruggerblogger is a FREE and unique sports app that gives the user a beautifully designed, interactive, infographic look at the match statistics from the All Blacks’ 2014 season, and unbeaten 2013 season of Test Rugby Union. It is a visually rich resource of game data that is essential for any All Black, or indeed any rugby union, fan.
Ruggerblogger compiles four years worth of New Zealand’s match statistic infographic sheets, including all All Blacks’ games for the entire seasons 2012-2014, and all 48 RWC 2011 matches, showing all the crucial game stats and score flow for each match.
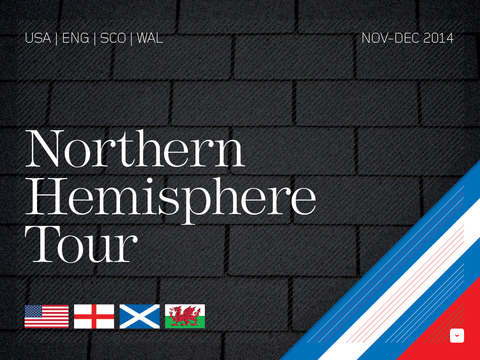
Whether it is the inbound tour/home series hosted by New Zealand, The Rugby Championship, The Bledisloe Cup, or the end of year Northern Hemisphere Tour… its all in here.
The interactive Test match stat sheets for 2013-2014 feature:
- all Test Matches from the last two seasons against England, France, Australia, Argentina, South Africa, Japan, Wales, United States and Ireland
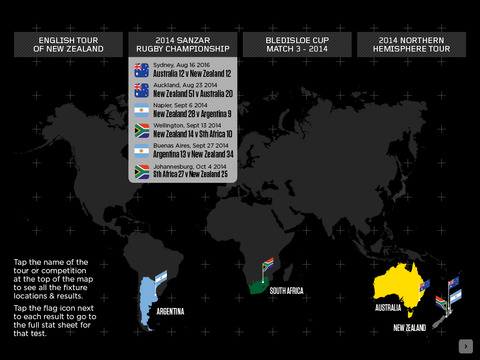
- an interactive global map showing all games, from which you can navigate your way to individual matches
- scrollable team lists showing the starting XVs and the full reserve bench
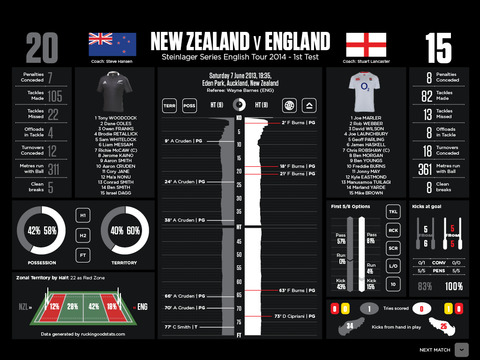
- interactive charts that show possession %, territory % and zonal territory % for for the first half, second half and full time
- interactive bar charts showing comparisons of crucial game performance measures including scrum & line out wins, tackle success, ruck clearances, and the first-five eight/fly half options taken
- a linear timeline showing all scoring by time and player
- charts showing the flow of possession and territory can be toggled on and off under the score flow to show who was dominating play at any stage
- a breakdown of crucial performance game stats from all 14 Tests graphed next to each other for comparison
- tables of player data for each match, each tour, and end of season for every All Blacks player who took the field
- tables of player stats that show the top tacklers, top scorers, top carries… and more.
All fourteen Test matches from the 2012 season are also presented as non-interactive infographics:
- all 14 Test Matches from 2012 against Ireland, Australia, Argentina, South Africa, Scotland, Italy, Wales and England
- an interactive global map showing all games, from which you can navigate your way to individual matches.
All 48 matches from RWC2011 in New Zealand are presented as non-interactive infographic slideshows:
- every Pool match, grouped in slideshows based on Pools A, B, C and D
- all quarterfinals, semi-finals, bronze play-off, and the RWC2011 final.
All game sheets feature the following:
- Full team lists
- Penalties conceded, tackles made, tackles missed, offloads in tackle, turnovers conceded, clean breaks made, metres run with ball
- Tries scored, kicks from hand in play, yellow or red cards awarded, kicks at goal success
- Bar charts for scrum & line out wins, tackle success, ruck clearances, and the first-five eight/fly half options taken
- Possession and territory percentage pie charts and a zonal territory diagram for the first half, second half and full time
- Timeline of the match showing who scored, how, and when, under which possession and territory flow can be showed.
The only app that shows All Black game results in full infographic glory. And it]s FREE.
Follow @ruggerblogger on Twitter for rugby related chat and free Super Rugby statistic sheets.